
Visualizing Genomes: The Chromosome Visualization Tool
Written by: E. Cannon, A. Wilkey and L. Sanderson
- Feb. 25, 2019

Written by: Ethy Cannon1,2, Andrew Wilkey2 and Lacey Sanderson3
1Iowa State University; 2USDA ARS; 3University of Saskatchewan
A whole genome view of genomic or genetic features that can can lead to new insights. For example, gene density compared with specific repeat families, regions of higher heterozygosity in mapping populations, and distribution of BLAST hits across a genome assembly are all cases where the researcher could benefit from a genome-wide view. CViT (Cannon and Cannon, 2010), a set of Perl scripts, was developed as part of the Medicago truncatula sequencing project in the early 2000s. Since then the application has been expanded and generalized to display any sort of feature than can be located on one or more backbones (typically chromosomes or linkage groups), in any linear coordinate system. A drawback to the initial Perl application was that the image is not interactive. To address this problem, and to update the graphics, it was rewritten in JavaScript, by Andrew Wilkey, as CViTjs. CViTjs in turn has been adopted into two Tripal (Sanderson et al., 2013) modules, Tripal BLAST UI and Tripal CViTjs embed through collaboration amongst Legume Federation members.
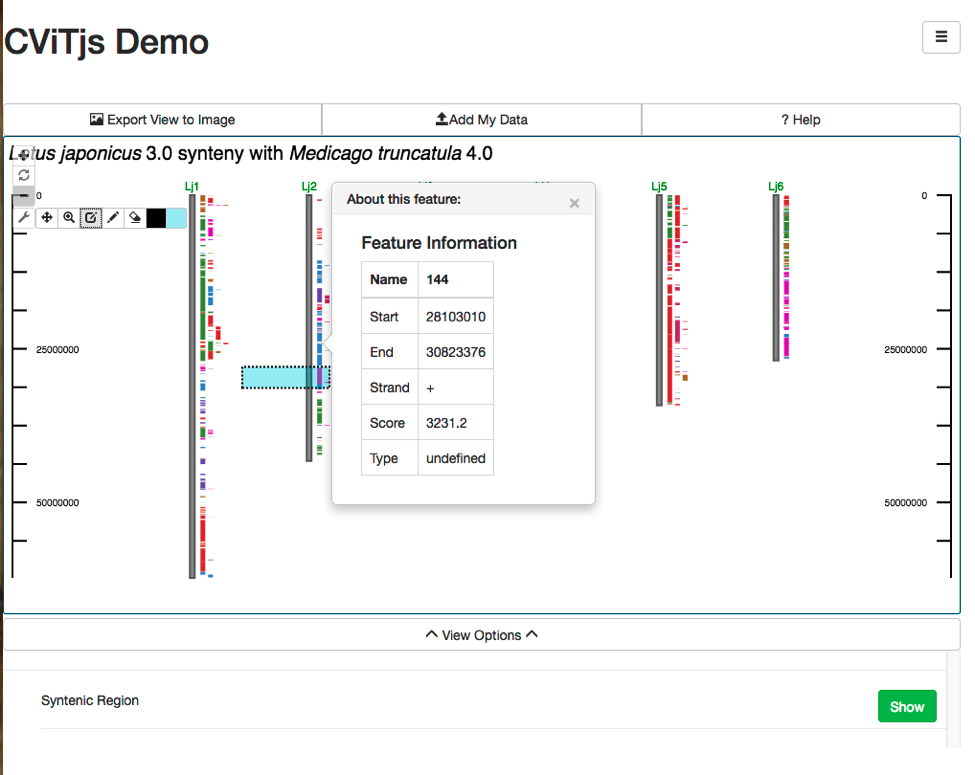
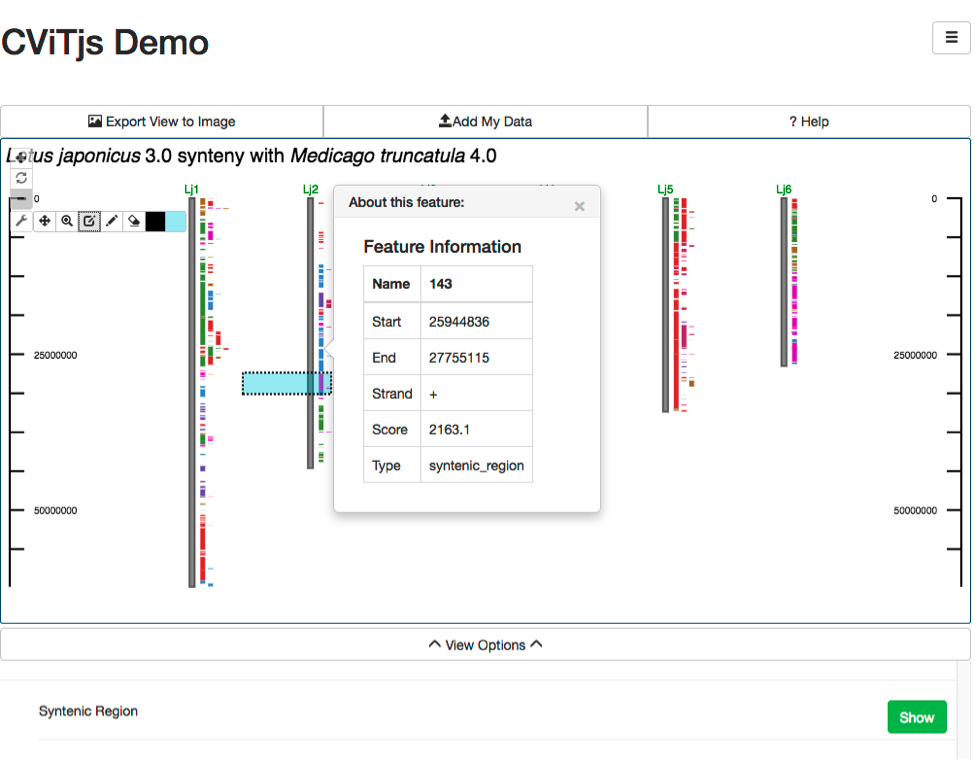
CViTjs is a rewrite of the original Perl CViT (described below). It was implemented in JavaScript by Andrew Wilkey, and provides an interactive whole genome view. The appearance of the image is controlled by a configuration file and a set of menus that permit resizing, hiding and showing features, and other options. Mouse-over popups and links can be set for each feature displayed. It can be embedded in pages or other web-based software as described below. Because of its interactive nature, and because the image is rendered inside a web page, the number of features that can be displayed without significant reductions in responsiveness is around 2000 genomic or genetic features, where a feature is a single gene, marker, BLAST hit, et cetera. CViTjs can be downloaded here.
Integration: Tripal BLAST UI module
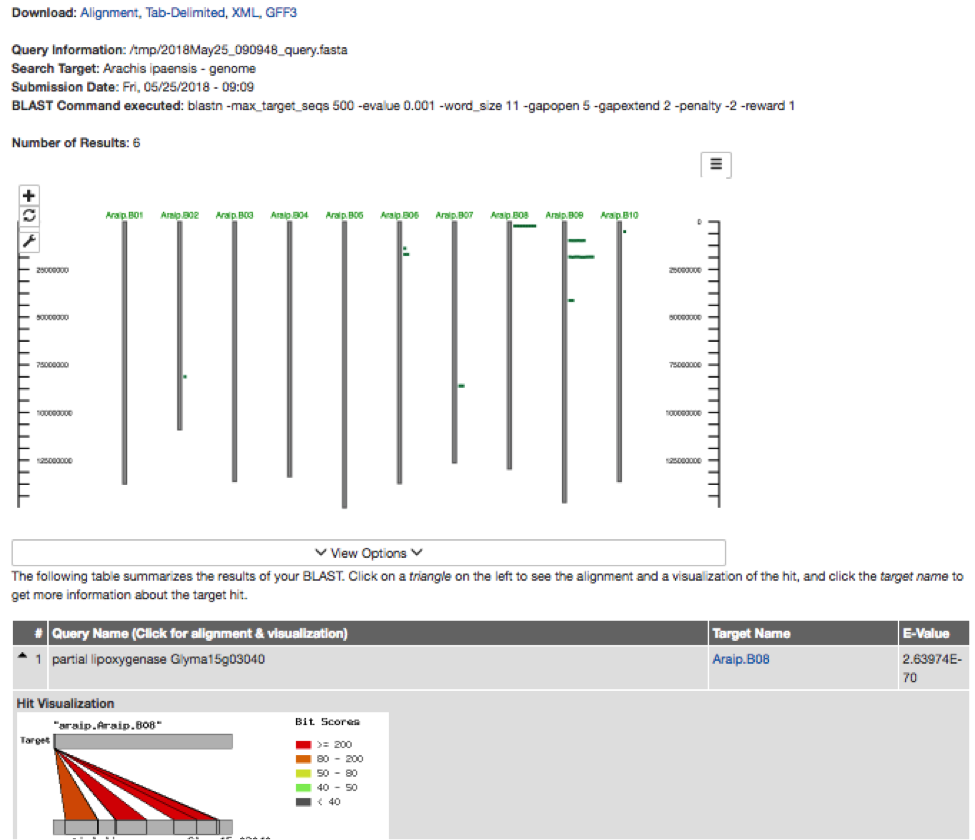
The Tripal BLAST UI is a collaborative effort between Legume Federation members to provide a generic, fully featured and customizable interface to the NCBI BLAST suite of tools. CViTjs has been integrated into the Tripal BLAST UI to display location of BLAST hits on the genome. The whole genome view is displayed at the top of the result page, with individual hits displayed below. There is an additional visualization of each hit, as seen below. This provides researchers with a visual indication of how many hits their query received, as well as, the distribution of these hits, which is often very helpful. For example, researchers engaged in association mapping of traits may already have a region of interest in mind and this genome-wide visualization can provide an immediate indication that a given gene is worth further investigation.
Integration: Tripal CViTjs embed
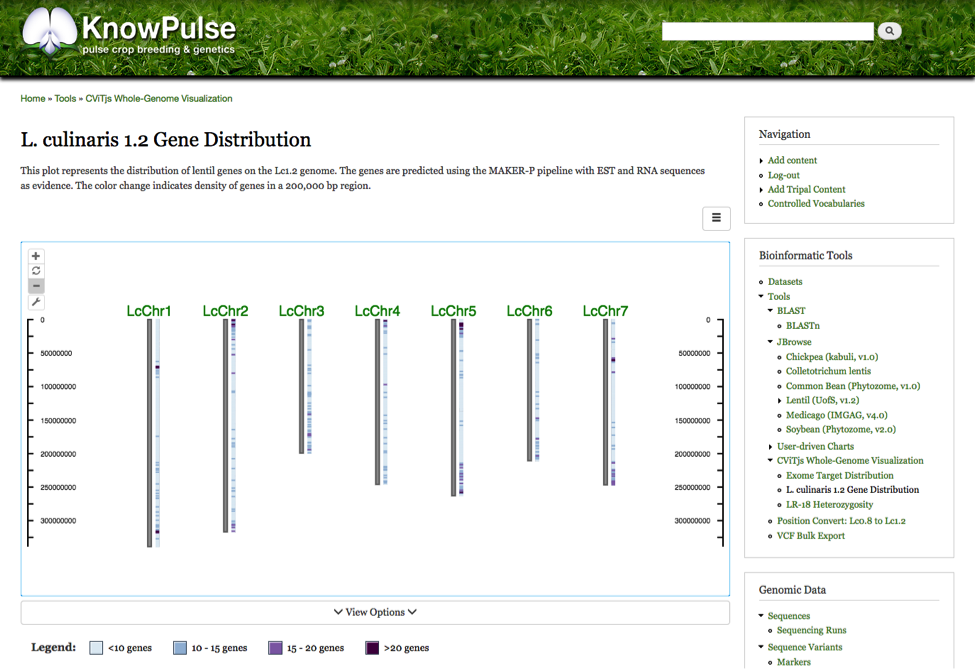
Tripal CViTjs embed was developed by the University of Saskatchewan, Pulse Research Bioinformatics group to provide generic embedding of CViTjs in community web portals built using Tripal. This allows whole-genome wide visualizations to be shared with a greater research community while maintaining the interactive nature of CViTjs. Currently the module makes all diagrams within a CViTjs installation available in one location on the web portal. The diagrams are completely integrated with the portal to provide a consistent user experience and make navigation and exploration of these diagrams intuitive. Future development will make CViTjs diagrams available on Tripal Content pages allowing these web portals to more seamlessly summarize their data in a whole genome context and alleviate the need to manually create each diagram for sharing with the community. The following example shows the distribution of genes on the current Lens culinaris genome assembly (v1.2). Furthermore, the sidebar menu shows the auto-generated “CViTjs Whole Genome Visualization” menu containing the current diagrams available.
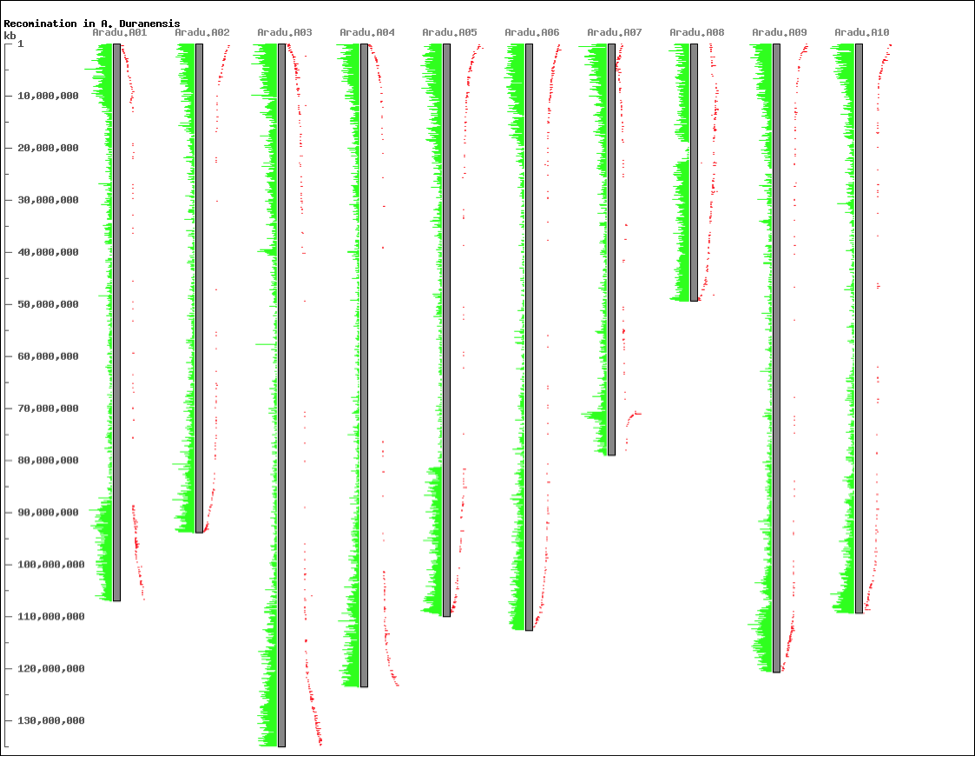
CViT is the original Perl application. It produces a static image suitable for publication, as either a PNG or SVG image. Although the functionality of the original CViT is largely available in the more interactive CViTjs, The older CViT does have one advantage over CViTjs: it can render over 100,000 genetic or genomic features, whereas CViTjs is limited to about 2,000. CViT is highly customizable via a configuration file, enabling users to change colors, positions, fonts, and many more aspects of the image. The image below shows gene density on the Arachis duranensis on the left side of each chromosome, and the recombination rates on the right side. This image shows, for example, the effect on recombination rates of an inversion at the end of chromosome 7, and the strange structure of chromosome 8 and its unusual recombination rates. CViT can be downloaded here.
References:
Cannon EKS, Cannon SB. 'Chromosome Visualization Tool: A Whole Genome Viewer'. International Journal of Plant Genomics, Volume 2011, Article ID 373875. http://dx.doi.org/10.1155/2011/373875
Sanderson LA, Ficklin SP, Cheng CH, Jung S, Feltus FA, Bett KE and Main D. 'Tripal v1.1: a standards-based toolkit for construction of online genetic and genomic database.' Database, Sept 2013: bat075. https://doi.org/10.1093/database/bat075