
Bringing Macrosynteny to the GCV Multi-view
Genome Context Viewer (GCV) version 1.3.0:
- by Andrew Farmer
- Sept. 10, 2018
The Genomic Context Viewer (GCV) is a web-app that provides interactive and synchronized comparative genomics visualizations. Comparisons are performed by determining conservation of gene order and orientation across related species or individuals using homology based on gene family assignments. GCV uses a “federated” model, bringing in genomic and/or gene family data provided by third party services rather than hosting all data in one place. Users can quickly assess cross-species or interspecies levels of conservation, novelty, and structural variation surrounding a region of interest. (Note: If you haven’t already used GCV and the description above didn’t give you a good sense for its capabilities, before you read this post about updated functionality please look at some the examples we’ve provided at our github repository; or better yet, give GCV a quick try from the interactive tour at LIS or using one of the examples at the LIS GCV start page).
Dynamic calculation of macro-synteny integrates genomes hosted at federated sites
In the previous release of GCV (1.2.0), we introduced new macro-synteny services that compute synteny blocks between chromosomes "on demand". Similar in spirit to the dynamic computation of microsynteny that GCV already performed, this allowed users to compare genomes coming from different federated sites at the whole-chromosome scale without relying on precomputed comparisons. For instance, one of the genomes managed by the Legume Information System (LIS) could be compared “on the fly” with genomes from the Medicago truncatula HapMap project or with an outgroup such as Arabidopsis thaliana.
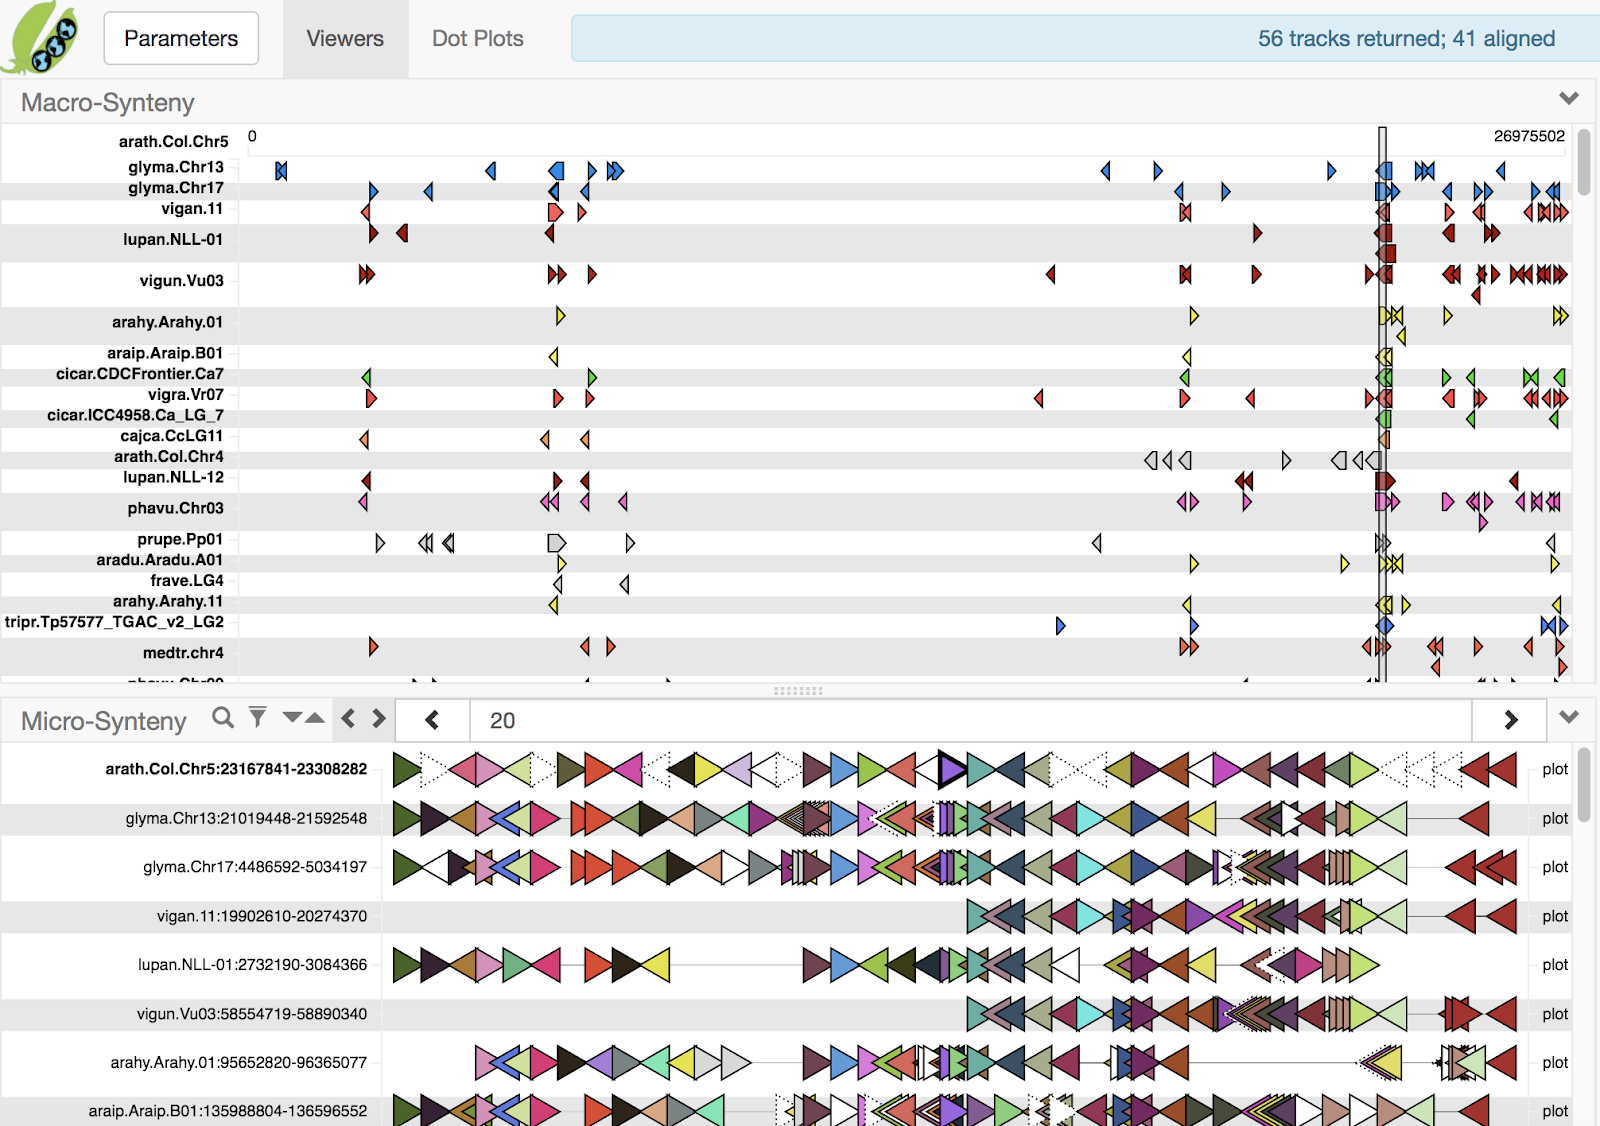
Search view (phavu.Chr02 as query) Multi-alignment of the same set of tracks
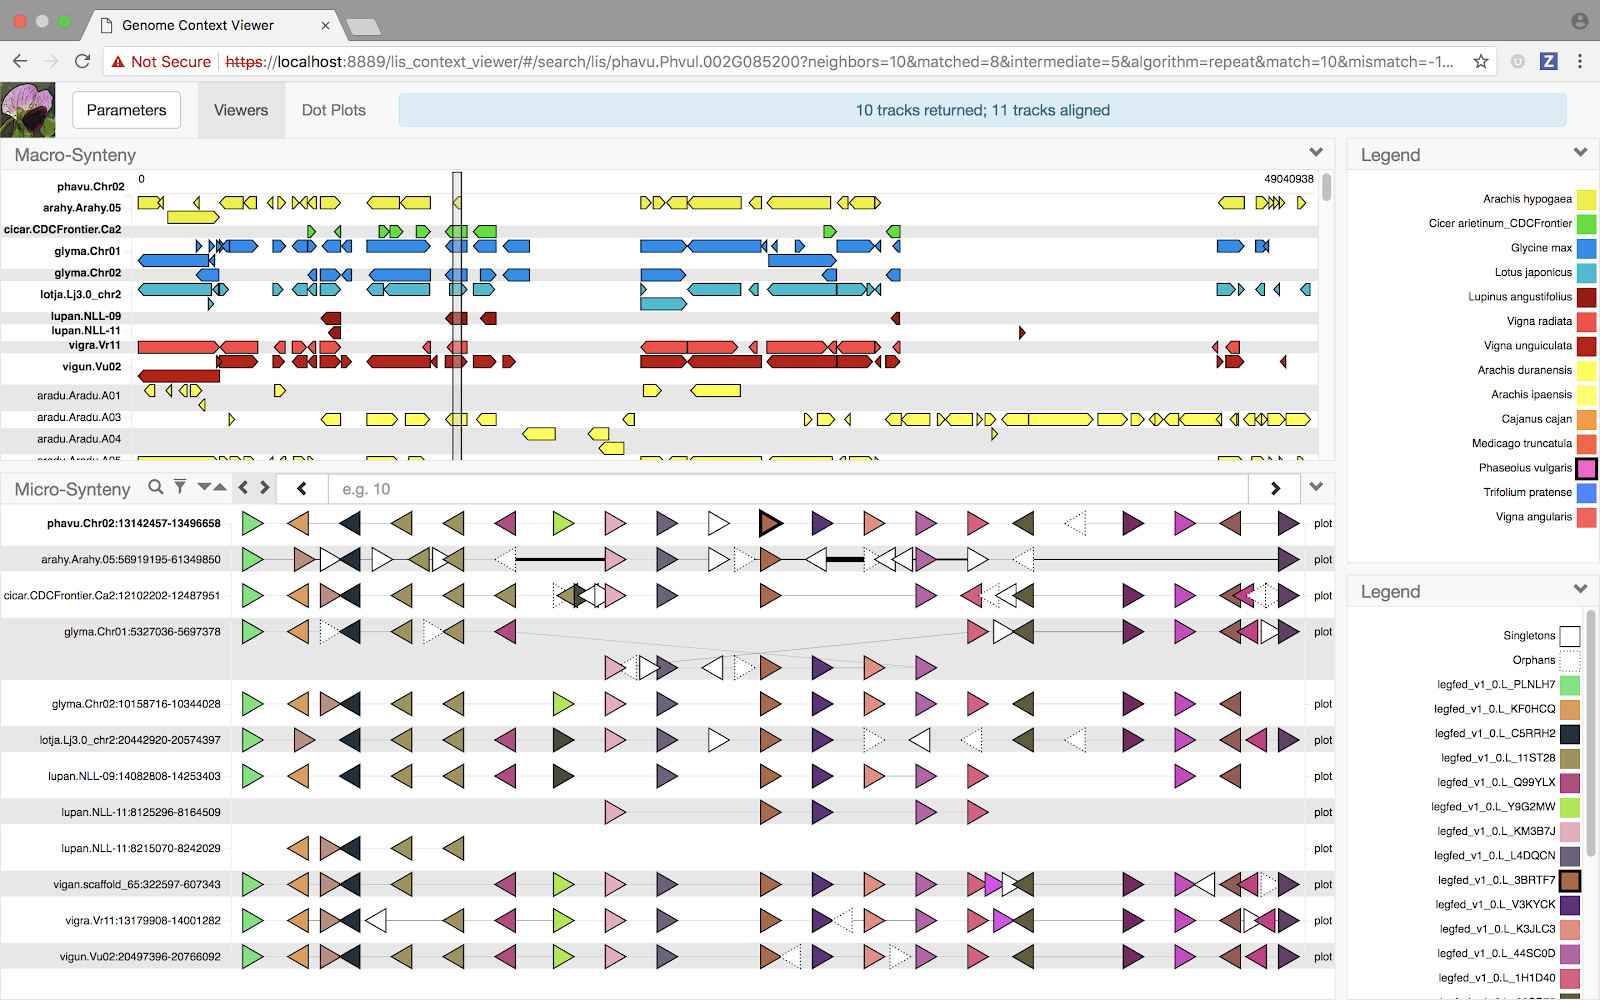
Using these on demand services, the macro-synteny viewer in the Search view was updated to display dynamically-computed blocks, expanding the breadth of the analysis across all federation sites. Unfortunately, the Multiple Alignment view still had no such viewer, due to a lack of a reference chromosome to compute blocks against and no means of drawing chromosome-scale multiple alignment blocks. Until now.
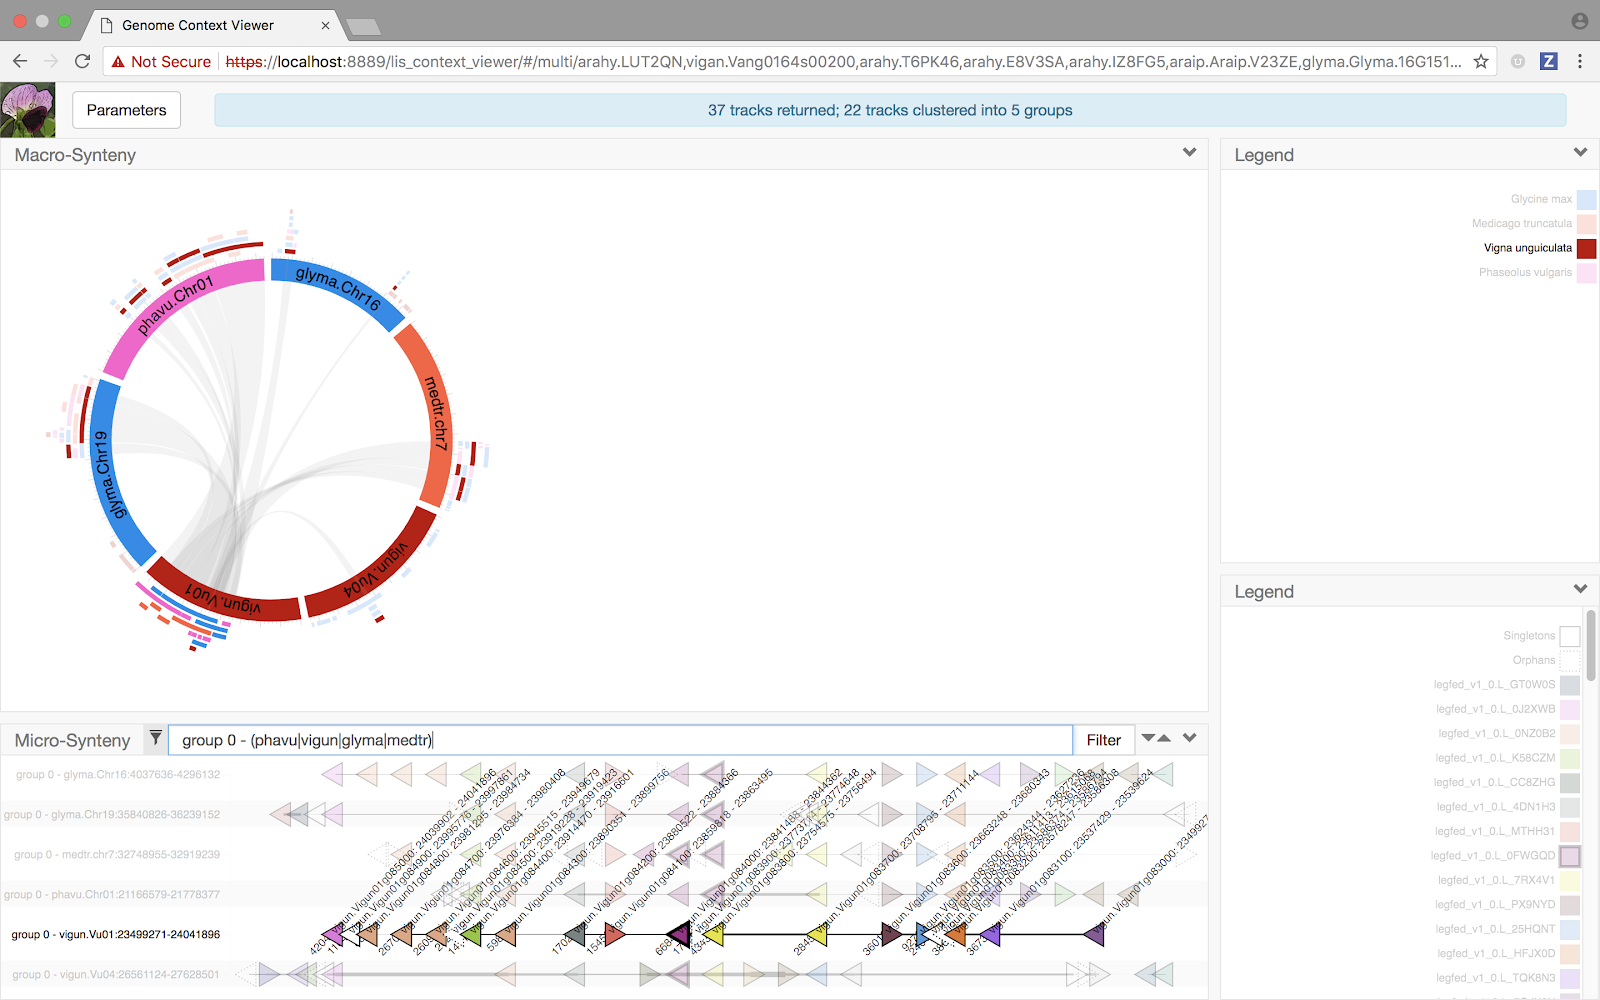
Multi-way genome comparison at the whole-chromosome scale
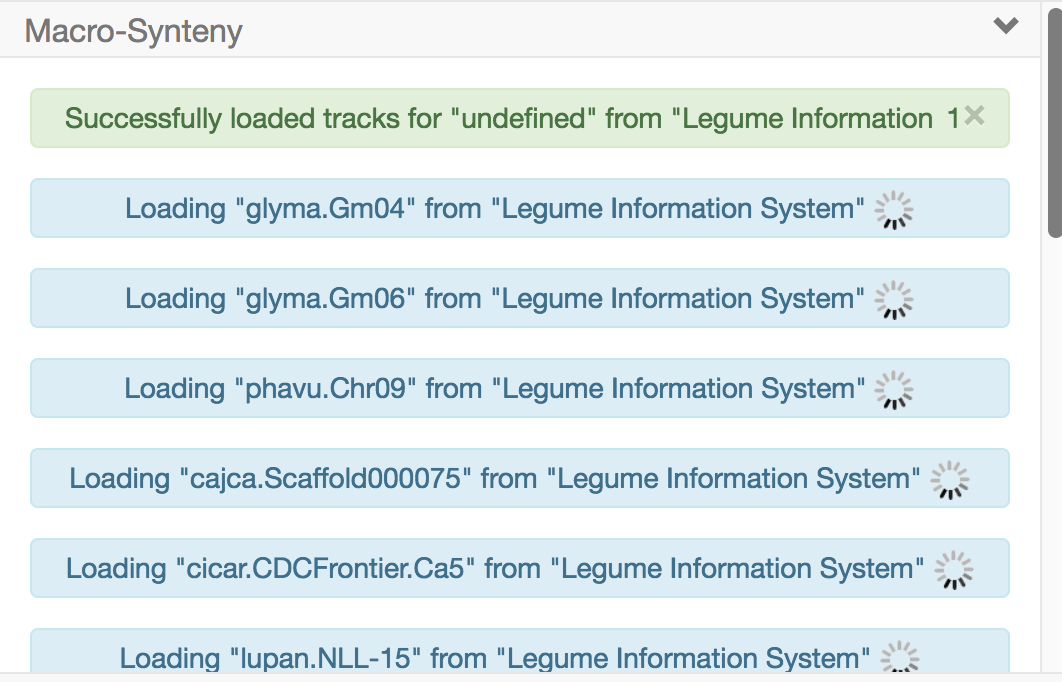
Now, when a Multiple Alignment view is initiated (for example, from a set of genes corresponding to the leaves of an LIS gene family tree), the on demand macro-synteny services are used to compute pairwise synteny blocks between all pairs of chromosomes present in the view across all selected data providers. This is potentially a lot of computational work! So we spent some time refactoring the GCV client code to support enhanced notifications and "streaming" of results. This means the Multiple Alignment view will begin displaying results as soon as it starts receiving them from the various data providers, updating the view dynamically as new results arrive.
But what about the visualization? Unsurprisingly, we have chosen to start with a Ciros-style plot, the de facto paradigm for a multi-way pairwise display of chromosomes. Starting from an LIS subtree clicking on an interior node will trigger a popup (as shown)
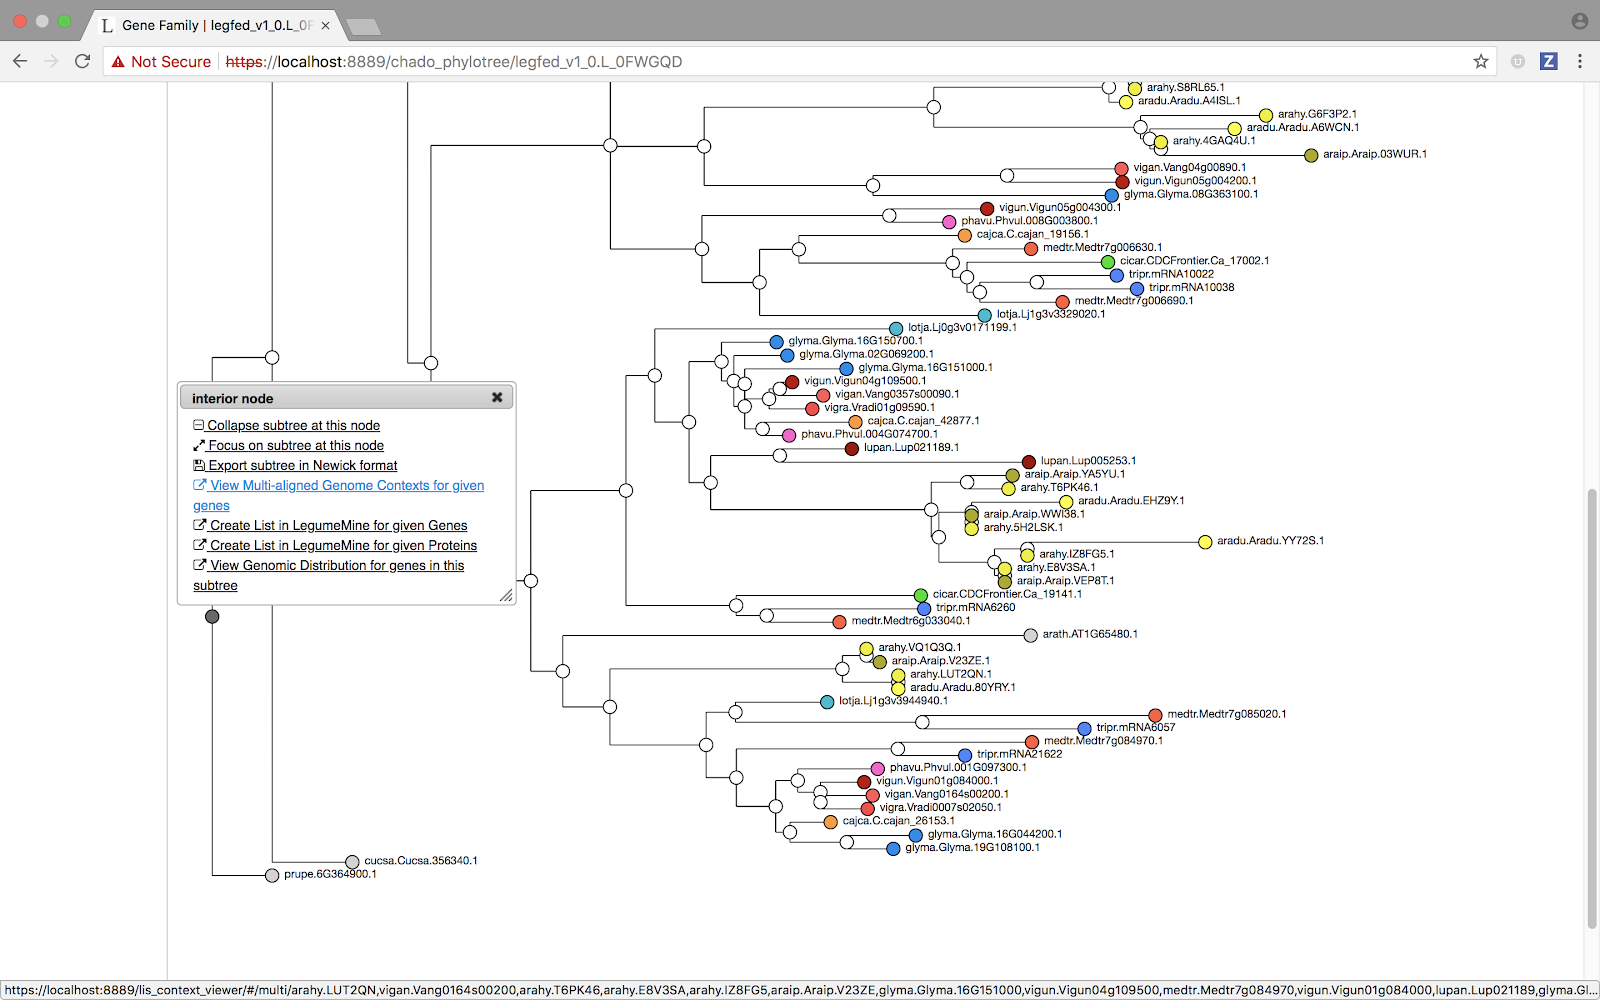
and selecting the “Multi-aligned Genomic Contexts” option will load the GCV Multiple Alignment view corresponding to the selected subtree.
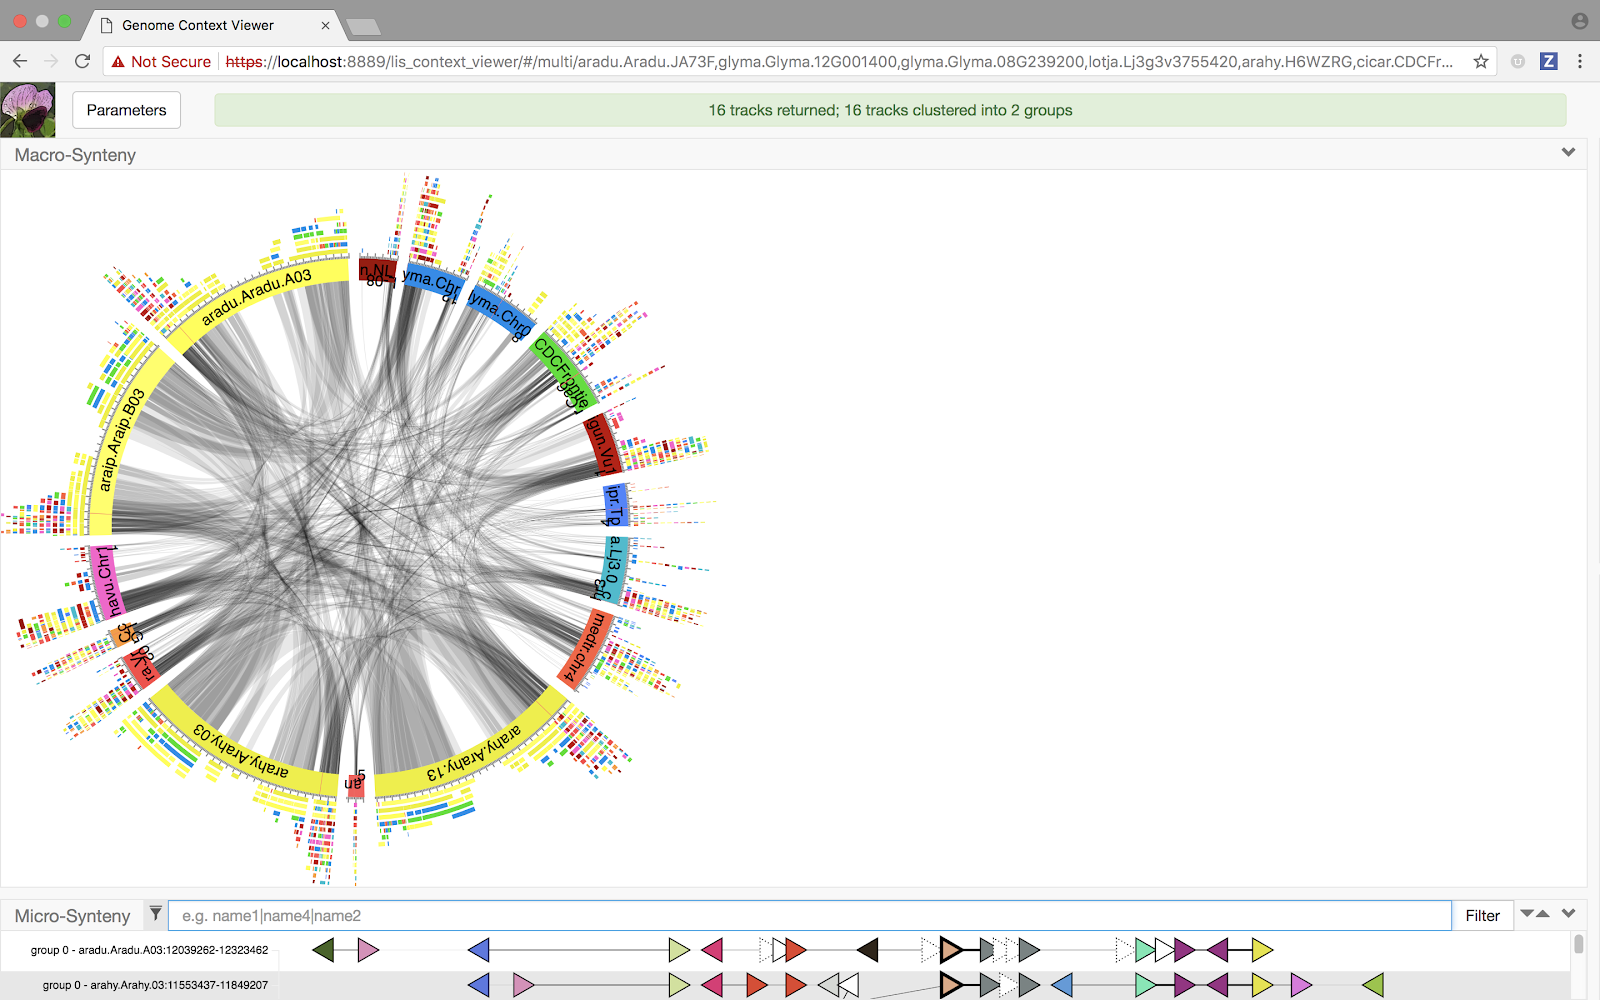
The resulting Circos plot is certainly colorful, if a little overwhelming! What insights can we learn from it? As with all GCV visualization components, we have made the new view interactive and synchronized with other components in the display. So, in this case, we might:
- Filter the micro viewer, causing a corresponding reduction in the number of chromosomes displayed in the macro viewer; perhaps based on one of the subgroups produced by the track clustering algorithm, and maybe also limiting to a subset of the species represented within that group.
- Mouse-over one of the chromosomes in the macro viewer, causing it to become the temporary focus in terms of the set of pairwise blocks displayed.
The result? Hopefully some of the chromosome structures are a little clearer.
We're excited about the capabilities that are on the horizon based on changes we've made for this release, but we're even more interested in hearing about how the new features improve the power of the GCV to give you insights into the complex genomic relationships among our favorite plant family (or what further changes we could make to help you get to those insights) - so let us know what you think! We're always looking for feedback from our users, even if just to let us know we need to do more to help you understand the capabilities of the current release. If you found this discussion useful, confusing, or just too much to read through, let us know that too!